
Because pages of plain text make results less accessible and insights less obvious, results are often best presented graphically. With this in mind, PoPy generates commonly used, configurable, print-ready plots and diagrams for you without any need for third party packages (e.g. R or PsN).
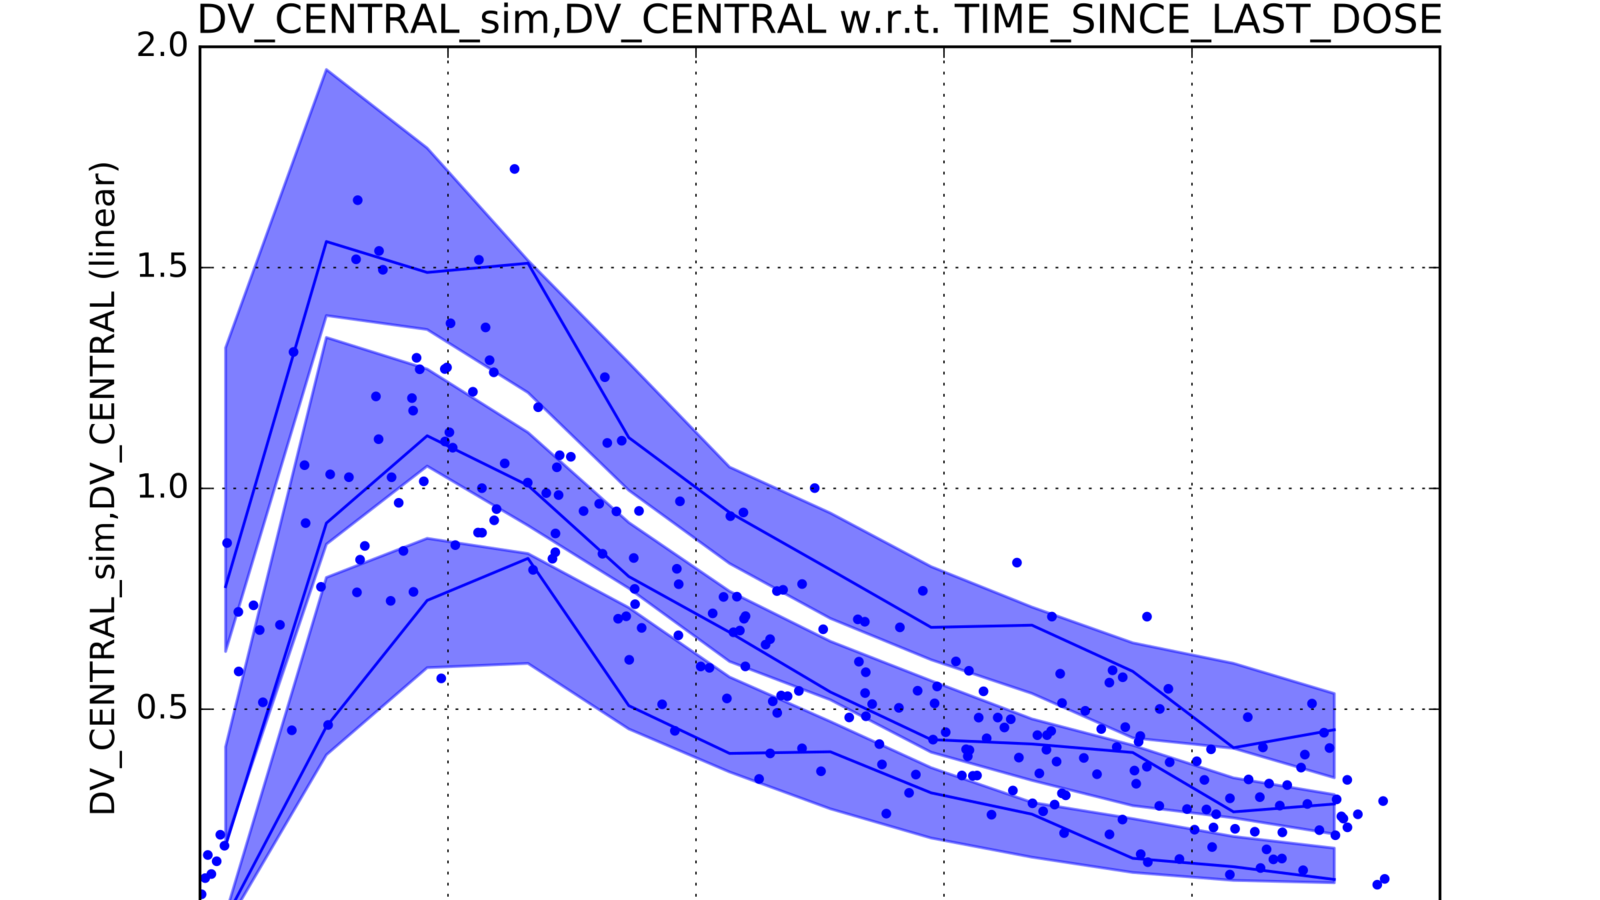
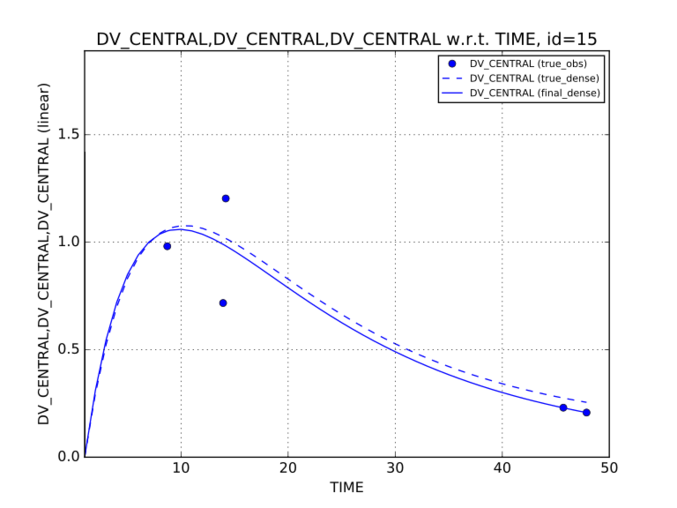
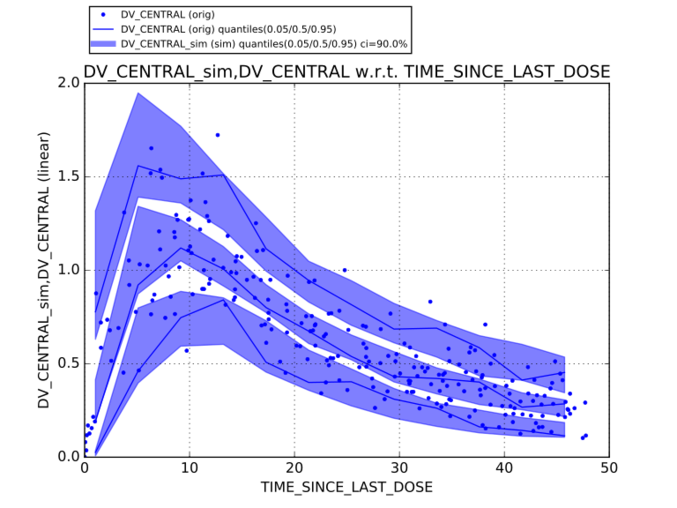
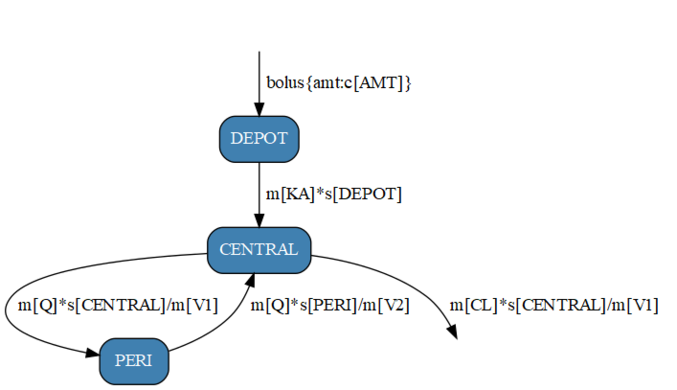
From smooth prediction/observation plots for individuals, to Visual Predictive Checks for populations, to automatically generated compartment diagrams, PoPy will create the graphs you need to get your message across.
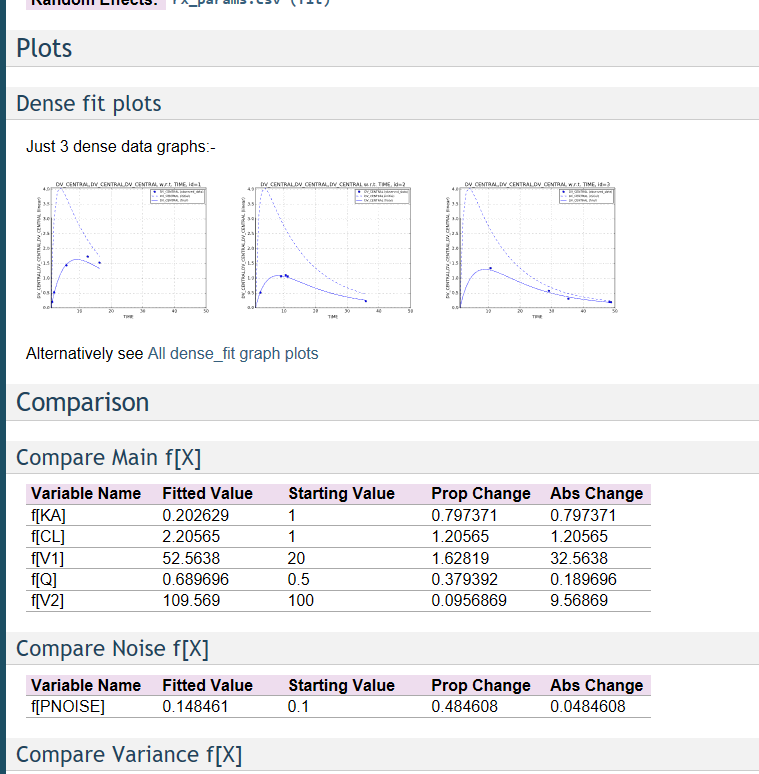
Automated Summaries
At the end of a run, PoPy also produces an easy-to-read summary of the outputs in hyperlinked HTML. The summary includes tables of initial and final parameter values, plus individual and population plots of the PK/PD simulations, so that you can see the results of your run at a glance.